- Software - Simulation
- Software
- Aeronautic software
- J2 Aircraft Dynamics
Monitoring software reportinganalysisfor aeronautics
Add to favorites
Compare this product
Characteristics
- Function
- reporting, analysis, monitoring
- Applications
- for aeronautics
Description
DISPLAYING AND MONITORING RESULTS
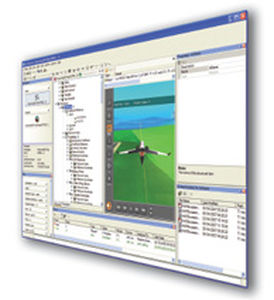
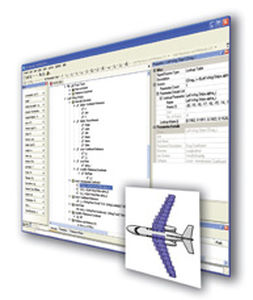
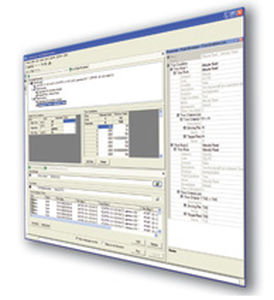
j2 Visualize, the data display plug-in of the j2 Universal Tool-Kit, enables designers to create monitors, graphs and traces with which to view the data either as an analysis is underway or as a post processing tool.
The system enables users rapidly to establish optimum configurations by plotting graphs from the evaluated data and by viewing and monitoring individual analyses as they happen. The plots and data can then be easily transferred into other applications for reporting purposes.
KEY FEATURES AND BENEFITS
1. Complete Data Handling Capabilities
No need to purchase additional graphics tools
2. User Defined Data Monitors and Plots
Quickly view and evaluate an aircraft’s behaviour
3. Cross Plot Results from Multiple Datasets
Create plots across the complete flight envelope
4. Overlay Results from Previous Runs
Compare the impact of design changes to older models
Compare predictions with actual flight data
5. Annotate Graphs
Highlight areas of interest
Copy results into documents for reporting
Catalogs
No catalogs are available for this product.
See all of J2 Aircraft Dynamics‘s catalogs*Prices are pre-tax. They exclude delivery charges and customs duties and do not include additional charges for installation or activation options. Prices are indicative only and may vary by country, with changes to the cost of raw materials and exchange rates.


